Debugging when you are not the hosting process
This topic comes up frequently when users are writing CLR Procs and Triggers. How do I debug the code that is being hosted by the database?
There is a very easy way to do it through the System.Diagnostics.Debugger namespace to launch the just in time debugger for Visual Studio.
Just in Time Prompting the user for the debugger
You can prompt the user to attach a debugger at runtime using the System.Diagnostics.Debugger. You wouldn't want to do this at runtime in a production environment Only for use on your development machines. I usually surround the block with an #IF DEBUG to ensure it gets compiled out at release time.
| Just In Time Debugger |
Copy Code
|
|---|---|
#if DEBUG // If we are not debugging force the debugger to attach if (!System.Diagnostics.Debugger.IsAttached) System.Diagnostics.Debugger.Launch(); else // Otherwise just force a break in the debugger System.Diagnostics.Debugger.Break(); #endif |
|
This code asks the debugger if it is attached, if it is not the user is prompted. You can say No when the dialog comes up and the execution will continue like normal. If you are in the debugger it will force a break on that line. This is very handy to debug CLR procs where the Data Builder or some other process is running the database commands and you want to be able to step into the CLR Proc and see what is happening in real time.
Just in Time Debugger Dialog
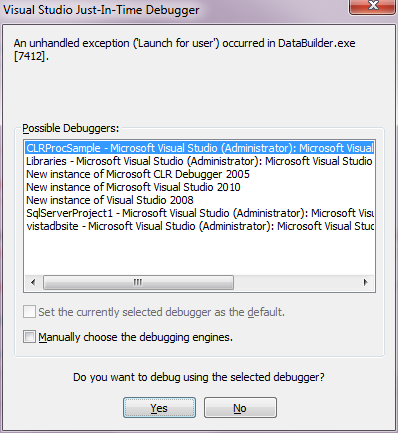
The Just-In-TIme debugger dialog will prompt for which debugger to use. The CLRProcSample is the correct project in this case because that is what I want to debug.
Notice that it shows all the editions of Visual Studio on my machine (2005, 2008, 2010) and all open projects. This makes it really handy for debugging CLR Procs, Triggers, just about anything that might be hosted external to a process you control.